Latest News


Abstract
Motivation: Genomic repositories are rapidly growing, as witnessed by the 1000 Genomes or the UK10K projects. Hence, compression of multiple genomes of the same species is becoming an active research area in the last years. The well-known large redundancy in human sequences is not easy to exploit because of huge memory requirements from traditional compression algorithms.
Results: We show how to obtain several times higher compression ratio than of the best reported results, on two large genome collections (1092 human and 775 plant genomes). Our input are VCF files restricted to their essential fields. More precisely, our novel LZ-style compression algorithm squeezes a single human genome to about 400KB. The key to high compression is to look for similarities across the whole collection, not just against one reference sequence, what is typical for existing solutions.
Availability: http://sun.aei.polsl.pl/tgc(also as Supplementary material) under a free license.
Supplementary data:available at Bioinformatics online.

Contact: sebastian.deorowicz@polsl.pl


Source: Techcrunch
Dr. Pollard will share her experience at the cutting edge of scientific research, as founder and faculty supervisor of the Gladstone Bioinformatics Core and an associate professor at the Institute for Human Genetics at the University of California, San Francisco. Pollard’s lab is known for developing statistical and computational methods that enable the analysis and study of massive genomic datasets. With her research focusing on genome evolution and the relationship between DNA sequences and biomedical traits, Pollard’s work has important implications for how science identifies and treats a wide range of diseases, from AIDS to atherosclerosis.
Together, Tecco, Douglas, Kaplan and Pollard will talk about how they are building their own businesses, what they’ve learned and how they plan to leverage the changes in technology to build a healthier world.

The conference starts September 7th and runs until the 11th at our favorite location, the San Francisco Design Concourse. Stay tuned for more speaker announcements and a few surprises to be announced soon.


Abstract

The regulation of gene expression in cells, including by microRNAs (miRNAs), is a dynamic process. Current methods for identifying miRNA targets by combining sequence and miRNA and mRNA expression data do not adequately use the temporal information and thus miss important miRNAs and their targets. We developed the MIRna Dynamic Regulatory Events Miner (mirDREM), a probabilistic modeling method that uses input–output hidden Markov models to reconstruct dynamic regulatory networks that explain how temporal gene expression is jointly regulated by miRNAs and transcription factors. We measured miRNA and mRNA expression for postnatal lung development in mice and used mirDREM to study the regulation of this process. The reconstructed dynamic network correctly identified known miRNAs and transcription factors. The method has also provided predictions about additional miRNAs regulating this process and the specific developmental phases they regulate, several of which were experimentally validated. Our analysis uncovered links between miRNAs involved in lung development and differentially expressed miRNAs in idiopathic pulmonary fibrosis patients, some of which we have experimentally validated using proliferation assays. These results indicate that some disease progression pathways in idiopathic pulmonary fibrosis may represent partial reversal of lung differentiation.


originally published in

published by:Simon Harold 

The low cost computing hardware Raspberry Pi is now being used to train the next generation of computational biologists, and is proving to be a low-cost alternative to more traditional methods of learning.
Bioinformatics is great and shouldn’t be limited to one small module” was the reaction of one enthusiastic undergraduate at the University of St Andrews (UK), following the 7 week teaching course entitled 4273 π Bioinformatics for Biologists.

They are of course correct on both counts.
Bioinformatics, or some variant of computational biology, arguably underpins a majority of modern basic biological analysis, and is working its way steadily into the realms of clinical and translational science. Think of the software you use to align your DNA sequences, infer genetic structure in your populations, or model the conformations of your newly crystallized protein. All are made possible because someone, somewhere, coded them into existence. Yet how many of us could code even a basic program of this type?

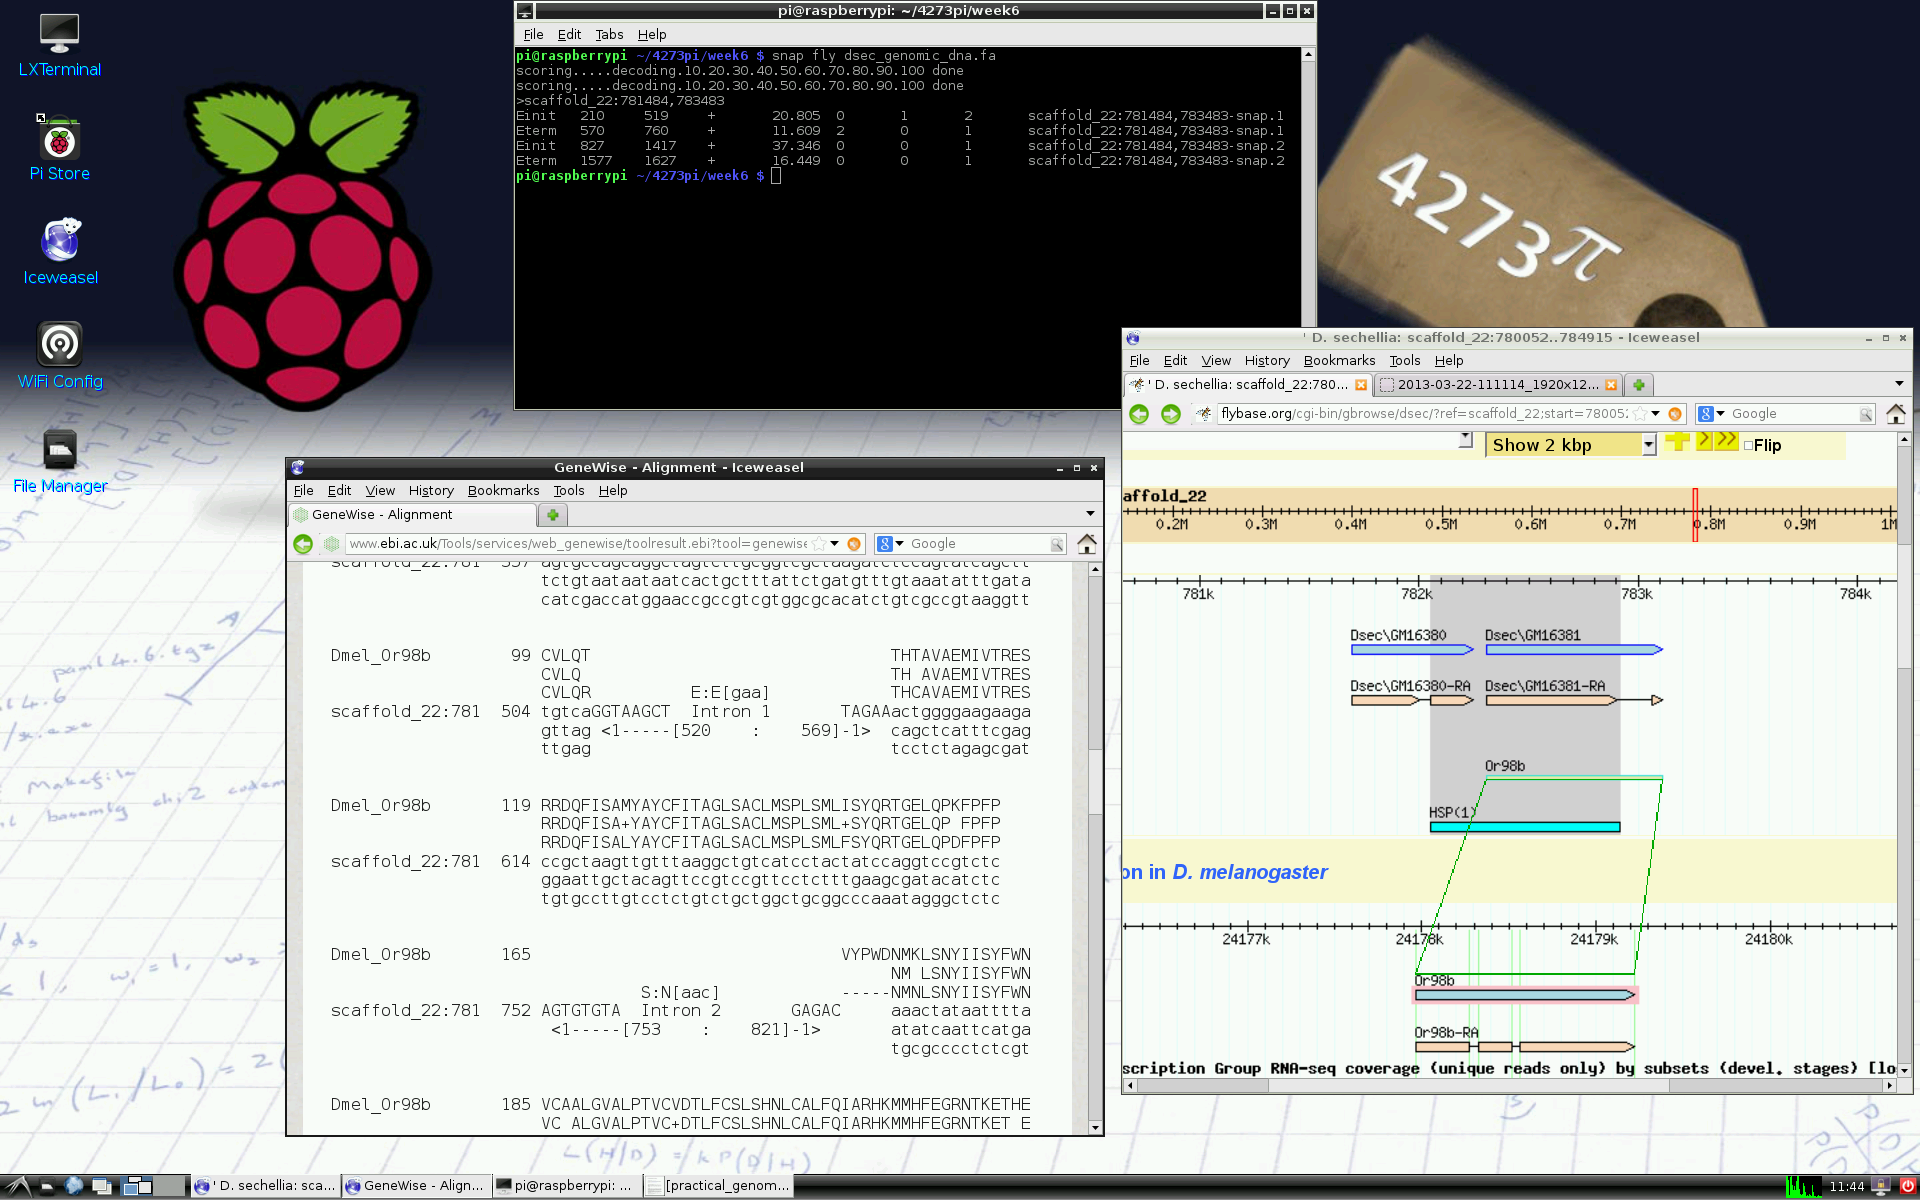
Fig1 Barker et al BMC Bioinfo (2013) 14, 243

One difficulty that contributes to this issue is teaching. Few university courses exist that offer dedicated training in bioinformatics, with researchers coming to the subject either as biologists with an interest in computation, or computational scientists with an interest in biology. Although there may not be a problem with bioinformaticians coming to the field through either of these routes, training the average bench biologist or early-career researcher to have basic skills in the field can be difficult. This is partly down to the diversity of subject areas to which computational skills need to be applied.

Speaking to Biome magazine, Ian Korf, Associate Director of Bioinformatics at the Genome Center at University of California, Davis, sees teaching such diversity as a real issue for university courses “One of the greatest obstacles to teaching bioinformatics is the teachers themselves. Bioinformatics is an eclectic field drawing from molecular biology, statistics, computer science, mathematics and other disciplines. Not many teachers have such a diverse education.”
Another problem is infrastructure. Whilst some universities may have access to vast computing power for researchers, gaining access to servers that allow students to experience administrative privileges, or simply give them the time to experiment with basic computational architecture, can often be problematic.
Now, an open access, open learning method developed by Daniel Barker and colleagues aims to strip this teaching back to basics by using the newly-developed Raspberry Pi computing system to let students experience full administrator rights and gain valuable insights into real-world bioinformatics. The low-costs involved (each computer typically costs around £30/$40/€35) also means that large-scale teaching may be achieved without university costing departments having to worry about whether their laptops will be returned in full working order at the end of the semester.

What’s in the Pi?
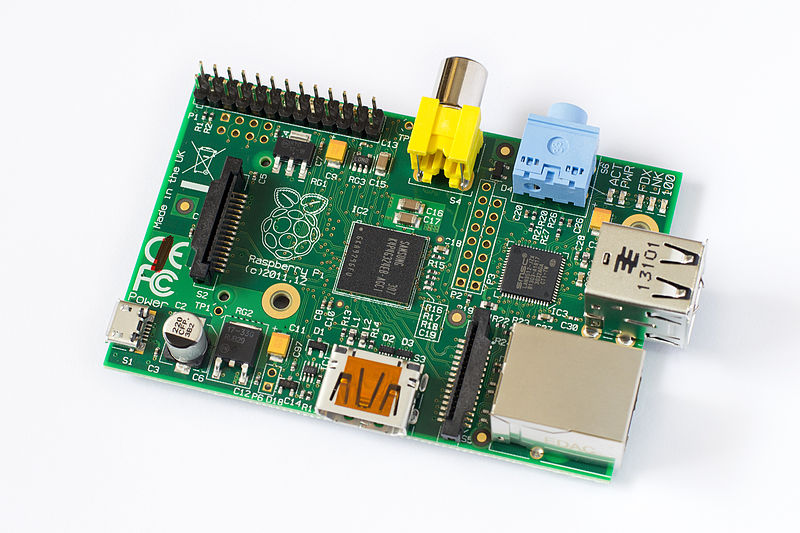
Raspberry Pi Model B Rev 2_Tors_Wikimedia commons cc
The hardware costs stay so low because the Raspberry Pi strips computing back to its basic elements. This credit-card sized computer eschews the modern movement toward bigger, faster processing by using a basic single-board device running an open-source operating system, without the usual hardware features like disk-drives and keyboards. Developed by a non-profit, British-based company, it is now being hailed as a revolutionary tool in facilitating mass-participation in home programming.
As well as some of the more frivolous uses to which the device can be applied, it is hoped that this low cost could not only pique a new generation’s interest in the anatomy of computing, but could also have much broader implications for access to teaching computation in the developing world. Barker feels that key to this is empowering the bench-scientist to lose their fear of the motherboard:
“Many would-be bioinformaticians get scared away because of the arcane syntax of the command line, their lack of computer programming experience, or a feeling that their mathematics skills are insufficient. These are just fears. If you hold their hand for a little while they can get through the scary bits, they will emerge on the other side self-empowered and with a new perspective on problem solving. It will impact everything from grocery shopping to genome analysis.”
A key part of this will be openness. Although developed specifically to run the bioinformatics teaching course at the University of St Andrews, Barker and colleagues acknowledge that thephilosophy of openness encouraged by this new hardware also needs to be translated into teaching, and have made the course fully available to anyone wanting to have a go if they wished: full course details can be downloaded as an additional file from their article in BMC Bioinformatics.


Fully-funded 3 year position, starting as soon as possible

The opportunity
Recent breakthroughs in sequencing technologies are transforming biosciences. Increasingly, individual laboratories perform de novo genome and transcriptome sequencing efforts. But due to the relatively short length of current reads, assembly remains challenging. The problem is particularly acute with plant genomes because of their large size, polyploidy, and massive gene expansions and contractions.
The successful applicant will contribute to on-going efforts in the lab to exploit orthologous sequences in closely related species to identify split and incomplete genes in draft genome and transcriptome assemblies.
The project is part of a larger collaboration between the Dessimoz Lab at UCL and Bayer CropScience NV (Ghent, Belgium), leading agronomical company, for the development of new methods and resources to better characterise evolutionary and functional relationships between model plant genomes and agronomically-relevant crop genomes. This project will enable more effective crop biotechnology, which is key to ensure food security and sustainable agriculture.
The successful applicant will be provided with strong mentorship and be given ample scientific training opportunities. She or he will based at UCL in the Bloomsbury area of London, but will have the opportunity to do short-term visits to the collaborator in Ghent.
The successful applicant will receive a tax-free stipend of currently £15,726 per annum. There will be additional opportunities to be sponsored for attending international conferences. The PhD study fees will be covered by the project (UK/EU rates).
Profile Sought
  1. Strong (first or upper second class) undergraduate or postgraduate degree in quantitative discipline (bioinformatics, computer science, statistics, mathematics, or related subjects)
  2. High degree of self-motivation
  3. Good ability to work independently and as part of a team
  4. Effective written and oral communication skills
  5. Demonstrated programming skills
  6. Ideally, prior experience in computational biology research

Applicants must be either UK/EU/Swiss nationals or resident in the UK for three years prior to starting the PhD.
How to apply
To apply, please send the following documents as single PDF by email to Dr Christophe Dessimoz (c.dessimoz at ucl.ac.uk):
  1. a covering letter highlighting your reasons for applying and your suitability for this studentship
  2. a copy of your CV
  3. the names and contact details of 2-3 references
  4. if available, links to your Bachelor or Master thesis, publications, code projects (e.g. GitHub repo) are appreciated

To ensure full consideration, applications should be received by 16 Sep 2013 at 5pm UK time.
  • For informal enquiries, please contact Dr Dessimoz to this above address.


Contributor
Mathukumalli Vidyasagar
Mathukumalli Vidyasagar is the Founding Head of the Bioengineering Department, University of Texas at Dallas. He is a Fellow of the Royal Society, UK. Read more


After (too long!) an absence, Mathukumalli Vidyasagar ("Sagar") returns with his Computational Biology Corner column. This time Sagar recounts an incident that reinforces the need to critically review your measurements!
In my last column dated about a year ago, I had addressed the lack of standardization in biological instrumentation. In that column I bemoaned the fact that two different platforms, each of which claim to measure exactly the same quantity, namely the amount of messenger RNA (mRNA) produced by various cancer tumor tissues, produce wildly different measurements. I must apologetically return to the same theme in this column, albeit under different circumstances.
To refresh the memory of the reader (and to introduce my earlier column to those who had not read it when it originally appeared), my students downloaded data on about 580 ovarian cancer tumors from the web site of the National Cancer Institute (NCI), specifically The Cancer Genome Atlas (TCGA) project. Gene expression levels of the several genes in each tumor sample had been measured using two different platforms. But when the sets of measurements were plotted against each other, there was no resemblance whatsoever between them! Therefore, any prognostic predictor based on one set of measurements will fail miserably on the other set of data, and it does not matter which one is used! To us engineers, it sounds fairly absurd to say "Well, if you use this platform, then these are the genes that give you the best predictions of your chances of recovery, but if you use that platform, then an entirely different set of genes are the best predictors."
But today's column goes one better, because it concerns two sets of measurements taken on ostensibly the same platform, but at two different points in time. To me the lack of repeatability on the same platform is far worse than repeatability across platforms, because it would cause me to question even the worth of a single platform.
In brief here is the story. About 18 months ago, one of our collaborators measured the expression levels of 1,428 micro-RNAs (miRNAs) in 94 tumors of endometrial cancer. He found that, out of the 1,428 x 94 = 134,232 measurements, about 43% came out as "NaN" (Not a Number). We had assumed that the NaN readings were due to the fact that the quantities being measured were too small to register, and thus replaced them by a very small number. Later on we got a fresh supply of 30 more tumors, and when some of the same miRNAs were measured on the new samples, there were hardly any NaN entries! So our collaborators re-measured the miRNAs on three of the old samples -- and this time again there were hardly any NaN readings! Exploring the mystery further, our collaborators discovered that the company that manufactured the hybridization system for the measurement platform had gone out of business, so the core facility was now using a different (and supposedly functionally equivalent) system for hybridization. Except that the expression levels were now 4 to 10 times higher, or an addition of 2 to 3 on a binary logarithmic scale. So the two measurement systems, taken as a whole, were not at all identical. However, knowing this, somehow we could "normalize" for this phenomenon. But we were hardly prepared for what happened next.
One particular miRNA measurement on the old and the new samples did not match at all!. The diagram below shows the situation. The blue curve is the set of measurements of the original samples and the red is for the new batch of 30 samples. There is the well-known two-sample K-S test that allows us to test whether or not two sets of samples are generated by the same (unknown) probability distribution. In this case however no such fancy mathematics is needed because one can see with the naked eye that the two sets of samples have nothing to do with each other.


Description
Oncodrive-fm is an approach to uncover driver genes or gene modules. It computes a metric of functional impact using three well-known methods (SIFT, PolyPhen2 and MutationAssessor) and assesses how the functional impact of variants found in a gene across several tumor samples deviates from a null distribution. It is thus based on the assumption that any bias towards the accumulation of variants with high functional impact is an indication of positive selection and can thus be used to detect candidate driver genes or gene modules.
How it works
Oncodrive-fm starts by computing three metrics of the functional impact of each non-synonymous SNVs (nsSNVs) found in genes across a list of tumor samples. Any measure of the impact of nsSNVs on protein function (or FI score) could in principle be used here. We have chosen three well-known methods whose scores may be obtained in a high-throughput manner to evaluate hundreds of nsSNVs in a few minutes. Stop-gain SNVs (stSNVs) and frameshift-causing indels (fsindels) are incorporated to the bias analysis by assigning them scores that are comparable to the highest-ranking tier of nsSNVs. Finally, synonymous SNVs (sSNVs) are taken into account with scores equal to those of bottom ranking nsSNVs.
The second step starts by averaging the FI scores of variants per gene and comparing them to the distribution of scores of variants in functionally similar genes. If somatic SNVs were obtained using a whole-genome or whole-exome sequencing approach, the null distribution contains all SNVs and fsindels detected across tumor samples. We call this the internal null distribution. On the other hand, if only a limited number of genes have been sequenced, the null distribution of each gene is composed of nsSNVs that occur naturally in human populations, or external mull distribution. The mean FI of each gene across all tumor samples is then probed for significance employing a permutations strategy.
How it performs
We have applied the Oncodrive-fm approach to three datasets of genes with SNVs and fsindels in samples of different tumor types: glioblastoma multiforme (gbm), and serous ovarian carcinoma (soc) produced within The Cancer Gene Atlas (TCGA) project and chronic lymphocytic leukemia (cll), produced within the International Cancer Genomes Consortium (ICGC) initiative. We were able to detect most genes also pinpointed by MutSig (a method that searches recurrently mutated genes) as significantly biased in gbm and soc. Moreover, we were able to detect recurrent genes with low functional impact which may not constitute true drivers and we uncovered other top-ranking functionally affected genes, some of which could be lowly recurrent drivers.
How to install and run
You will find detailed information on how to install OncodriveFM and run some examples at Bitbucket
How to cite
If you use OncodriveFM, please cite it as Gonzalez-Perez A and Lopez-Bigas N. 2012. Functional impact bias reveals cancer drivers. Nucleic Acids Res., 10.1093/nar/gks743.
Any comments or feedback, please contact
Abel González Pérez, PhD
Bioinformatician, Postdoctoral Researcher
Research Unit on Biomedical Informatics - GRIB
Parc de Recerca Biomèdica de Barcelona (PRBB)
abel.gonzalez@upf.edu
Original version
We distribute the original PERL implementation of OncodriveFM in a tar ball below. You will need the PERL interpreter installed in your computer as well as the Statistics::Descriptive cpan package in your PERL5LIB directory. You will also need an R installation. The functional_impact_analysis.pl and pathways_functional_impact_analysis.pl scripts use R it. If your R executable cannot be invoked directly, please make a shortcut or edit these two scripts accordingly. You can run the examples provided (gbm and cll) by doing:
>./pipeline_launcher.pl ../config/cll.config
or
>./pipeline_launcher.pl ../config/glioblastoma.config
from the bin directory of the installation.
You may open and check the config files for an explanation of all configuration arguments.

OncodriveFM 0.0.1 is the version presented in the submitted paper and can be downloaded from here and the documentation from here